
Every Berry Counts: A Season of Growth at Camshorn Vineyard
- richieellingham
- May 27
- 4 min read
Updated: Jun 3
How HoloCrop's 3D modelling system measured more than 60,000 individual grape berries — without picking a single one.

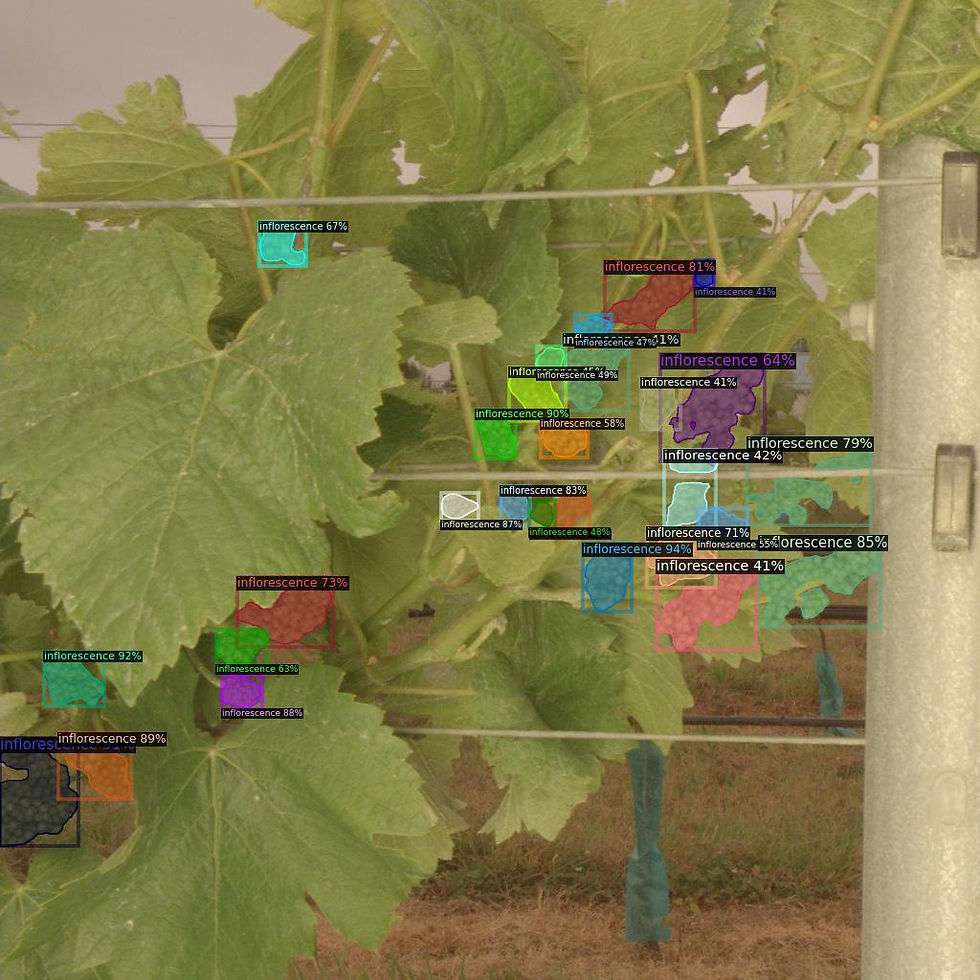
Snapshots of our 3D capture of a savignon blanc vine - showing three distinct growth stages and segmentation of leaves, wood, and grapes in 3D.
Ask a grower how their crop is sizing up and you'll get a thoughtful answer — one shaped by walking the rows, using calipers and counts as well as squeezing a few berries between thumb and forefinger, and decades of pattern recognition. It's a craft, and a good one. But it's also a sample of a few dozen berries standing in for a block of millions.
We wanted to know what would happen if the sample wasn't a few dozen. What if it was all of them?
A season in three snapshots
At Camshorn vineyard bay/panel number 113113, we tracked berry radius size across the 2025/26 growing season. Three measurement passes. No berries removed from the vine. No destructive sampling. Just the entire visible crop, measured in 3D.
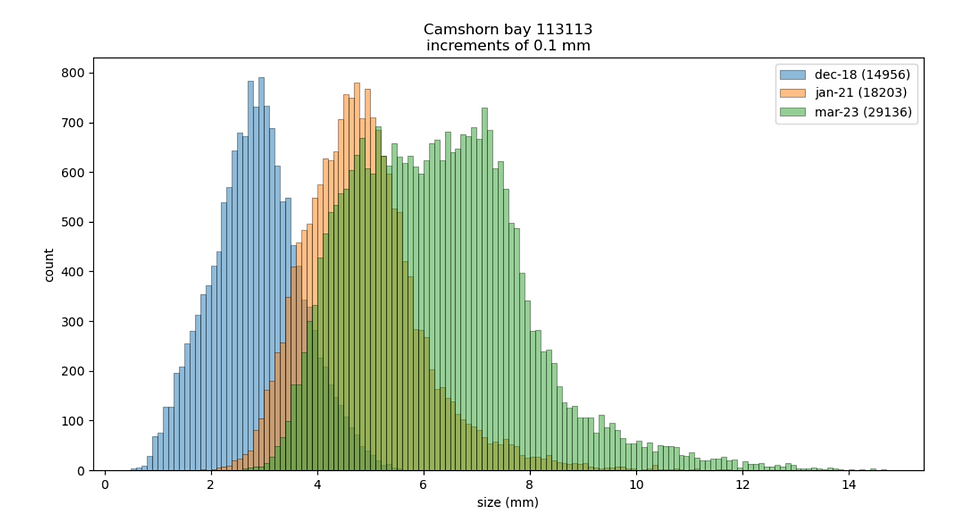
The raw count and size (radius) of each of the grape berries over three time periods in the 2025/26 season.
The numbers behind each fruit radius distribution:
18 December — 14,956 berries measured. Modal size around 3 mm. Fruit set is complete; the crop is pea-sized and uniform, the distribution tight and almost Gaussian.
21 January — 18,203 berries. Mode has shifted to roughly 5 mm. The peak is sharper and taller — berries are growing in lockstep through cell division and early expansion.
23 March — 29,136 berries. Mode around 7 mm, but look at the shape: broader, flatter, with a long tail stretching past 10 mm with hints of a bimodality appearing.
The count climbing across passes isn't more fruit appearing — it's more fruit becoming detectable as berries enlarge and the canopy opens. By March we're seeing nearly double the berries we saw in December, from the same vines due to these two facts - lower occlusion and larger berry size.
Note: this technology is still in development so sizing and count metrics still aren't perfect but we believe this is the most precise data you can get without a complete strip pick analysis.
What the shape of the curve is telling you
With a bit of research and experience we can now hypothesise the reasoning behind the data. A single average berry size, the way it's traditionally reported, would collapse each of these distributions into one number and throw the most interesting information away.
Watch what the shapes reveal instead:
The December curve is narrow and symmetric — a young crop developing in unison. The January curve is even tighter at the peak — the population is still moving as one. By March, the curve has broadened and gone slightly bimodal, hinting at two populations growing at different rates within the same block. That spread is the signal of variability that drives uneven ripening, and it's exactly the kind of thing a thumb-and-forefinger check can't surface at scale.
Knowing which parts of a block or plants are leading or lagging — and by how much — might be the difference between a single harvest call and a more nuanced pick plan.
How long did this take?
The scan capture process - we drive to the vineyard, unload the rover, select the rows to scan and let it capture autonomously. As for scan time - a whole 300m vineyard row takes row takes approximately 15mins to scan. We then drive back to our HQ to upload and process the data. The upload for one bay takes a few seconds. Each bay (post to post) takes us 30 mins to process to obtain 3D counts and sizing data shown in the above images. The real time spent was in developing the intelligent software and scanning system doing the scan and generating the metrics! We are constantly researching ways to decrease the processing time and I believe we will be improving processing time by an order of
magnitude in the years to come. In time this process will become so easy that any grower, researcher, or consultant will be able to do this themselves and focus their energy from data capture to data analytics and making valuable vineyard decisions - using block scale accurate data processed overnight.

Our autonomous scanner 'Beetroot' gathering data.
Why measuring everything matters
Manual sampling works, until it doesn't. A 50-berry sample carries roughly a ±15% confidence interval on the mean — fine for a directional read, less fine when you're deciding when to harvest a high-value parcel. Push the sample to thousands, then tens of thousands, and the confidence band collapses. The variance you're left looking at is real vineyard variance, with negligible sampling noise.
That changes the questions you can ask:
Is this block/plant ripening evenly, or are we looking at two harvests dressed up as one?
How does berry size at veraison predict final yield, by row, by vine?
When the season throws a curveball — a heat spike, a wet week — how does the distribution respond on a block/plant level, and how quickly?
On a block/plant level is there something fundamental holding back the full yield potential?
For the first time, these questions have answers grounded in the full population rather than a bunch or bud estimation proxy for it.
What's next
Camshorn Bay 113113 is one bay in one season. The same approach is now running across multiple sites, fruits, varieties, and trellis systems, and we're will be starting to see distribution signatures that travel — patterns in the curve shape that will show up consistently in cooler vintages, in stressed blocks, in vines coming back from a frost. Now we are starting to complete sparse sampling on row and block level for a variety of crops such as apples, and cherries, as well as grapes.
Berry counts and sizes have always been valuable. Counting and sizing all of them, accurately, and repeatedly, through a season, is something else.
Want to see what your blocks look like at this resolution? Get in touch with the HoloCrop team


Comments